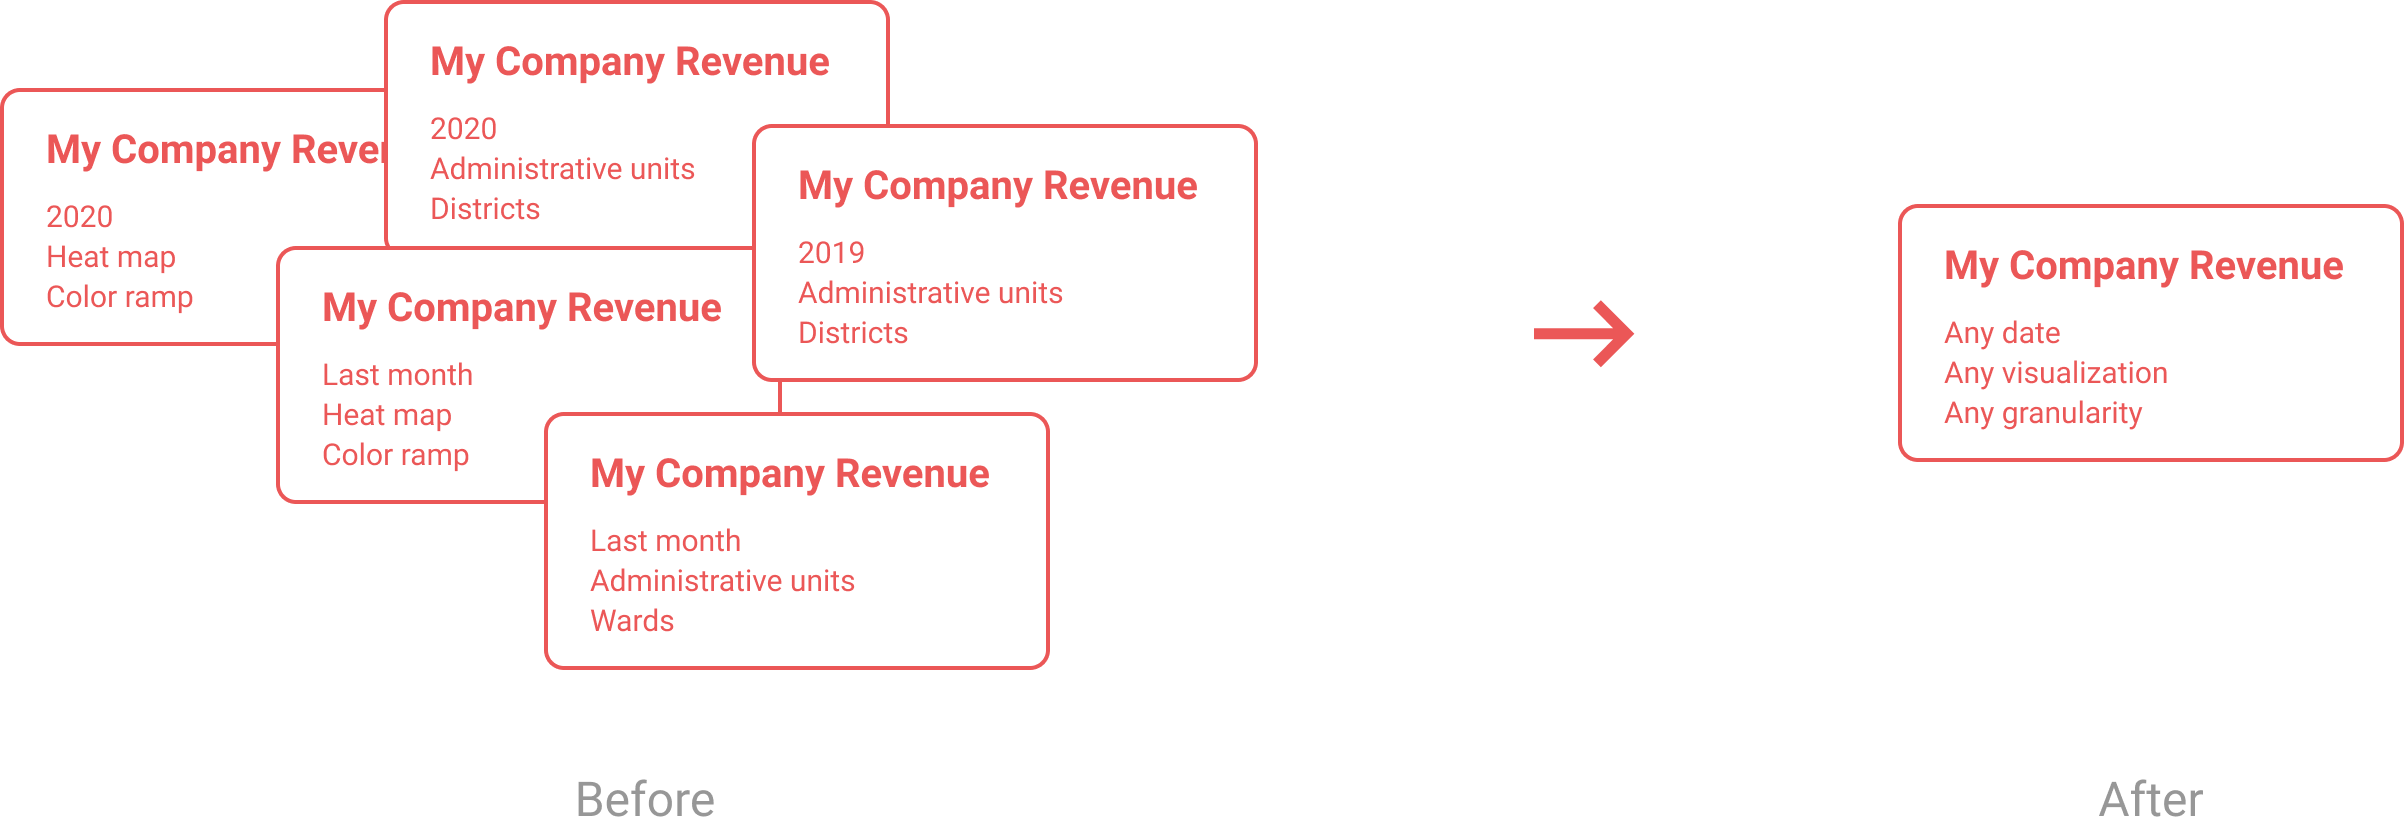
It was quite apparent that allowing for various angles of looking at a particular use case, all within one single View, is the only correct way how to tackle this.
Three universal controls were created:
Three universal controls were created:
Global date
Controlling for what time period will the data be shown
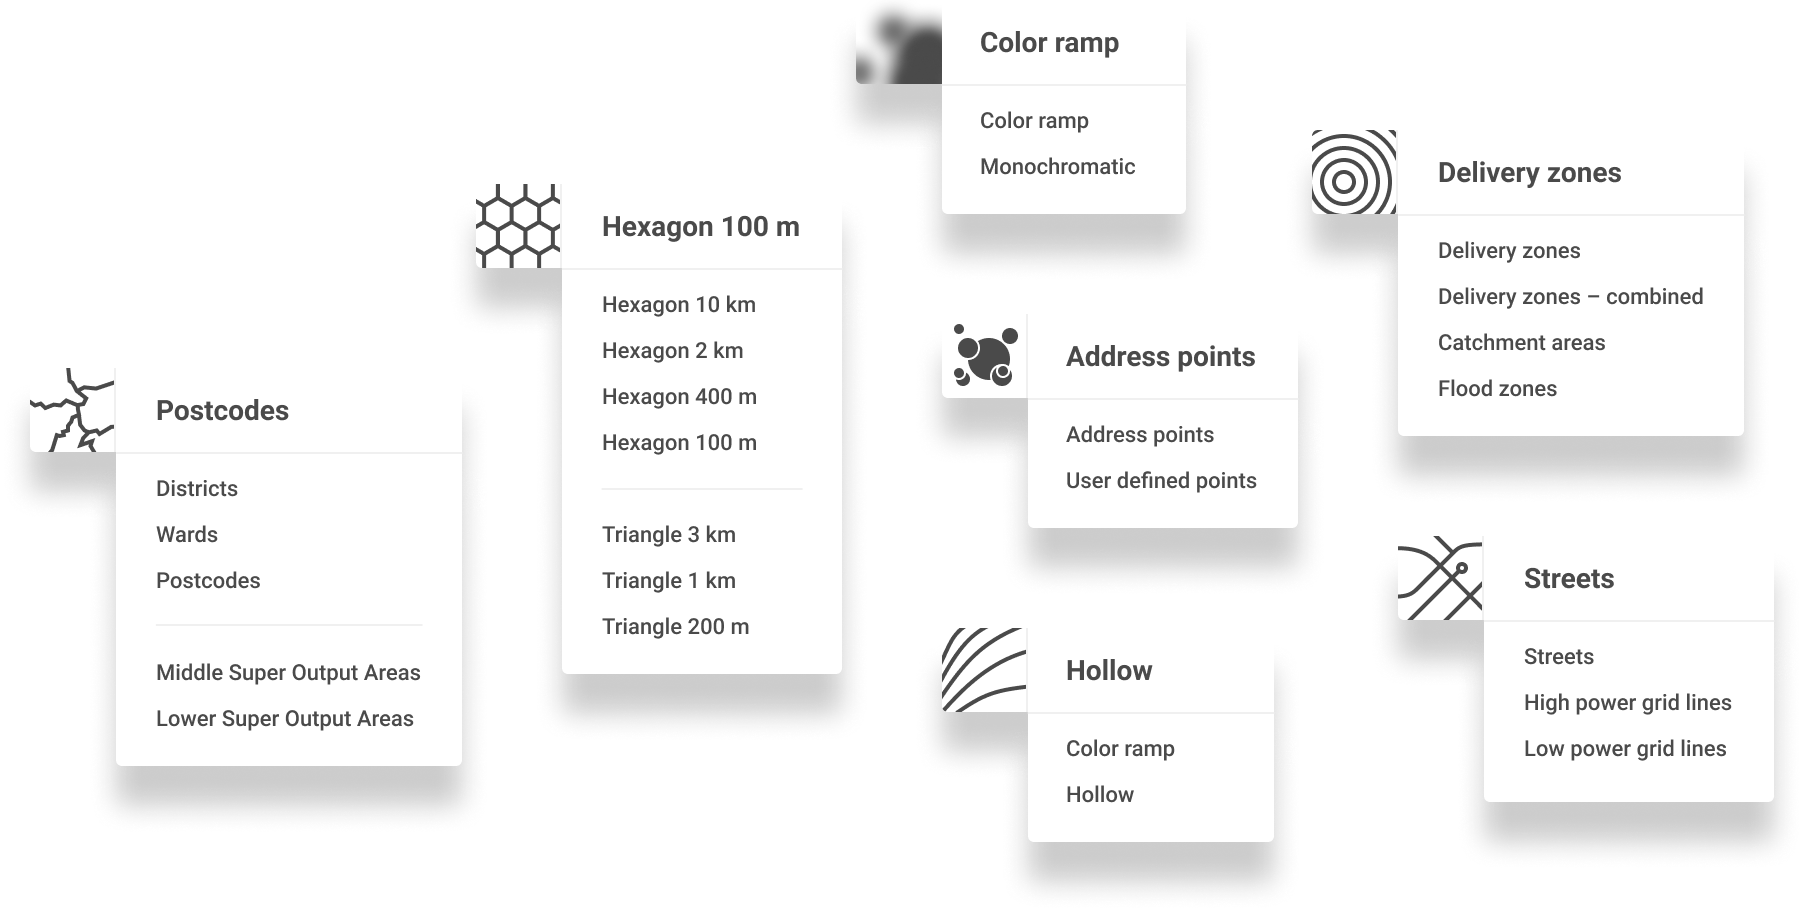
Visualization
Controlling how are the data displayed
Granularity
Controlling at what level of detail will the data be analysed

These controls became inherent part of each View. They were placed right on top of the map allowing for any time quick access. All three were immediately adopted by users and became some of the most fundamental features of the entire product.
Visualizations were also further developed, going from basic administrative units and heat map to seven different visualisation methods. This has finally lived up to the promise of delivering a professional "data visualization" platform.