Building a Location Intelligence tool (almost) from scratch


When I joined CleverMaps, the product was still at its later stage of conception, quite unbaked and immature. It was being built on the go mainly by developers, GIS professionals and inputs from sales. The interface, user flows and analytical capabilities were prevalently based on highly specific clients' — not actual users' — needs.
The product suffered from a good deal of serious usability, consistency, discoverability and other issues. The interaction costs were massive due to the massive information overload. It was trying to provide advanced spatial analysis while omitting some very fundamental functionalities. Only a handful of people outside our team could successfully navigate the product or dig some deeper meaning from it. The friction was too high and the gap between the information on the screen and the end user was too deep.
Designing for an emerging new field was a challenging task. If CleverMaps was to be successful, the product had to be rethinked ground up on a conceptual level. I had set four main baseline rules, that became the new foundation.
Majority of geographical information systems back then bloated with robust functionality. But one had to be a GIS expert to properly utilise them. The bar for any previous GIS knowledge requirements had to be pushed as low as mentally possible. Anyone with zero GIS knowledge was supposed to be able to work with and gain insight from CleverMaps.
Charts, ranks, numbers, statuses... That's what business intelligence has been after for years already. Location intelligence has to be all about its greatest asset: the where component. The map had to become the actual cornerstone of the product with all the other elements supplementary to it—not the other way around.
That sounds pretty obvious, but relevant information has no clear contours when dealing with huge amounts of data from different business verticals with thousands of possible use cases and opposing user archetypes. The information hierarchy and flow had to be completely redefined and the entire UI stripped to the bones to even begin to figure out what the relevant information means and in what contexts.
The product had to universally satisfy wide range of very diverse uses—not providing ad hoc solutions to very specific needs of few specific clients. It had to be flexible and consistent at the same time and introduce a lot of supporting peripherals to really become a fully mature product—not just a bunch of features stitched together.
Location analytics is not an easy game. Even with considerable previous knowledge the orientation was still very difficult. It was in fact so bad, that members of our own team were unable to find certain information they themselves put up there for a client several weeks ago.
The product was claiming it is not "yet another GIS tool", while users needed to be virtual experts to retrieve any meaningful results from it. The learning curve had an extremely unfavorable shape.
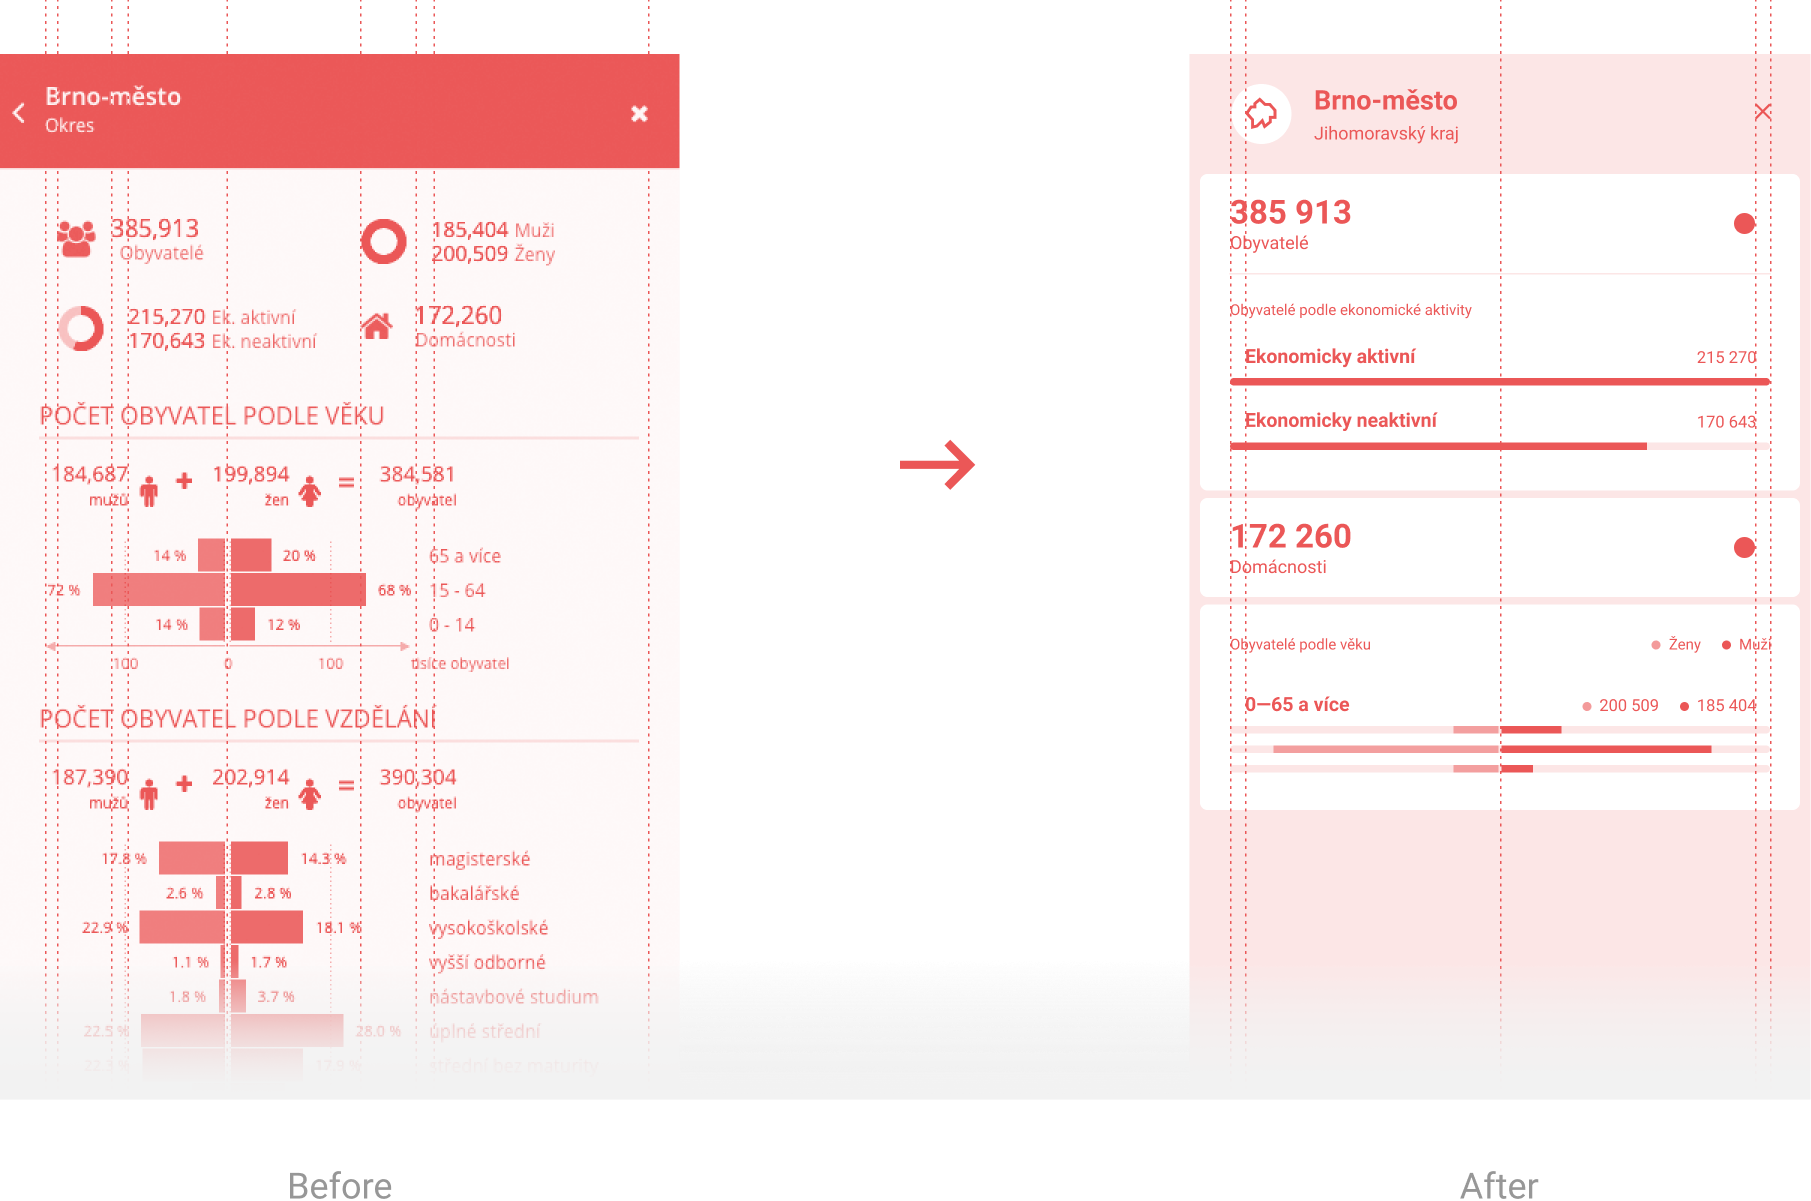
This was addressed by various interventions as part of the general redesign. Consistent and clear visual hierarchy of information was introduced, content was structured into logical groups, user interface was generally uncluttered by removing unnecessary and confusing elements, moving additional information under drills or introducing the dreaded concept of “more white space”.
The introduction of headers to every panel state, clear labeling of every important element of the UI and unification of nomenclature cracked down on raging inconsistency and indicated to users where they are and what are they looking at. Entire knowledge base, step-by-step onboarding and tutorials were also built from scratch, providing users with emergency tools to better understand the platform.

Question mark tooltips available for every metric and every information block provided essential prompt explanation and linked to further information inside the knowledge base. In-app support with a dedicated team member was finally ready to answer anyone's questions pretty much real time. Simplification and diversification of demos showcased the variety of possible use cases in several different verticals. Demos also later served as ready-made templates, helping to close the gap between still quite complex creation of a project and non-technical users.
Dysfunctional search has been completely revamped allowing users to easily navigate not only through the map, but also through available data objects. Refining the search was now possible narrowing down the results in a common situation of thousands of data objects at hand.
Dysfunctional search has been completely revamped allowing users to easily navigate not only through the map, but also through available data objects. Refining the search was now possible narrowing down the results in a common situation of thousands of data objects at hand.
